3.
WATER
QUALITY Monitoring
Monitoring Requirement
3.1
The monitoring frequency will be once per month for six
months at all designated monitoring stations during dry and wet season for Case
1 and 3. At the same time Case 2 and 4 will require a monitoring frequency of once
per month for three months during dry season. The monitoring stations are
listed in Table 3.1.
3.2
Water sampling will be conducted twice per monitoring
day during mid-ebb and mid-flood tides at three water depths (1 meter below
surface, mid-water depth and 1 meter above seabed). Parameters such as
temperature, dissolved oxygen (DO) concentration, DO saturation, turbidity,
salinity, pH and E. coli will be
monitored.
3.4
A total of 58 monitoring
stations are designated for the water quality monitoring according to the
EM&A manual, with the beach locations and the Fish Culture Zone being the
sensitive receivers. The
monitoring locations were chosen as close to the original coordinates as
possible to ensure the collected samples are representative to the sensitive
receivers.
3.5
The monitoring stations are illustrated in Figure 2-1, and the coordinates of the stations divided into
the 4 Cases are shown in Table 3.1.
Table 3.1
Water Quality Monitoring Station
|
Description |
Easting |
Northing |
|
|
Case 1 - Emergency
Discharge of Screened Sewage via all the Stage 1 and Stage 2 PTWs |
|||
|
B7 |
Anglers’
Beach |
823836.36 |
825044.52 |
|
B8 |
Gemini Beach |
825215.29 |
824933.71 |
|
B9 |
Ho
Mei Wan Beach |
825388.98 |
825067.17 |
|
B10 |
Casam Beach |
825731.46 |
825330.90 |
|
B11 |
Lido Beach |
825917.78 |
825385.83 |
|
B12 |
Ting Kau Beach |
826277.40 |
825519.01 |
|
B13 |
Approach Beach |
827237.94 |
825301.02 |
|
B14 |
Ma
Wan Beach |
824431.47 |
823415.85 |
|
B24 |
Big Wave Bay Beach |
843474.09 |
811730.33 |
|
B25 |
Rocky Bay Beach |
844030.05 |
810286.64 |
|
B26 |
Shek O Beach |
843891.17 |
809864.31 |
|
B30 |
St.
Stephen’s Beach |
839990.14 |
808461.60 |
|
B31 |
Chung Hom Kok Beach |
838616.79 |
808752.43 |
|
B32 |
South Bay Beach |
838104.70 |
809598.73 |
|
B33 |
Middle Bay Beach |
838056.97 |
809993.31 |
|
B34 |
Repulse Bay Beach |
838008.93 |
810827.28 |
|
B35 |
Deep Water Bay Beach |
836785.60 |
811635.55 |
|
F1 |
Tung
Lung Chau Fish Culture Zone |
847571.26 |
813102.00 |
|
F4 |
Lo Tik Wan Fish Culture Zone |
831366.51 |
809221.48 |
|
F5 |
Ma
Wan Fish Culture Zone |
823875.25 |
823699.48 |
|
WSD4 |
Tsuen
Wan flushing water intake |
828908.71 |
825681.26 |
|
WSD5 |
Tsing
Yi flushing water intake |
829862.33 |
823104.16 |
|
WSD6 |
Cheung
Sha Wan flushing water intake |
833991.16 |
820235.42 |
|
WSD7 |
Kowloon
South flushing water intake |
833968.78 |
818053.54 |
|
WSD9 |
Tai
Wan flushing water intake |
837955.17 |
818412.01 |
|
WSD10 |
Cha
Kwo Ling flushing water intake |
841379.00 |
817859.28 |
|
WSD11 |
Yau Tong flushing water intake |
842149.61 |
816974.14 |
|
WSD12 |
Tsueng Kwan O flushing water
intake |
845512.14 |
817421.15 |
|
WSD13 |
Siu
Sai Wan flushing water intake |
843904.21 |
814469.38 |
|
WSD15 |
Sai
Wan Ho flushing water intake |
841215.41 |
816451.38 |
|
WSD17 |
Quarry Bay flushing
water intake |
839685.64 |
817081.46 |
|
WSD18 |
Central
Water Front flushing water intake |
833935.18 |
816624.15 |
|
WSD19 |
Sheung Wan flushing water intake |
833383.13 |
816836.34 |
|
WSD20 |
Kennedy Town flushing
water intake |
830826.34 |
816244.46 |
|
WSD21 |
Ap Lei Chau flushing water
intake |
834105.49 |
810567.95 |
|
WSD22 |
Wan
Chai flushing water intake |
836246.19 |
816134.92 |
|
VM12 |
Gradient
Station |
830542.34 |
821139.51 |
|
VM14 |
Gradient Station |
829254.66 |
825159.72 |
|
VM15 |
Gradient Station |
832707.02 |
818964.77 |
|
VM8 |
Gradient Station |
830363.95 |
817092.23 |
|
VM7 |
Gradient Station |
832495.44 |
817473.60 |
|
VM5 |
Gradient Station |
836091.75 |
816541.13 |
|
VM2 |
Gradient Station |
839713.80 |
817641.47 |
|
VM4 |
Gradient Station |
838056.49 |
817637.50 |
|
VM1 |
Gradient Station |
841809.43 |
816567.96 |
|
JM3 |
Gradient Station |
844931.70 |
816956.95 |
|
EM1 |
Gradient Station |
844379.62 |
815140.61 |
|
EM2 |
Gradient Station |
845472.92 |
813712.75 |
|
EM3 |
Gradient Station |
845771.79 |
810953.82 |
|
WM1 |
Gradient Station |
830685.17 |
812441.28 |
|
WM2 |
Gradient Station |
827881.70 |
816189.04 |
|
WM4 |
Gradient
Station |
825354.99 |
823325.61 |
|
SM3 |
Gradient Station |
833462.67 |
809640.82 |
|
SM2 |
Gradient Station |
836402.69 |
809492.93 |
|
MM13 |
Control
Station |
864290.82 |
808693.11 |
|
SM17 |
Control
Station |
814115.31 |
801690.83 |
|
Case 2 – Temporary Bypass
of Screened Sewage via the Stage 1 PTWs |
|||
|
B7 |
Anglers’
Beach |
823836.36 |
825044.52 |
|
B8 |
Gemini Beach |
825215.29 |
824933.71 |
|
B9 |
Ho
Mei Wan Beach |
825388.98 |
825067.17 |
|
B10 |
Casam Beach |
825731.46 |
825330.90 |
|
B11 |
Lido Beach |
825917.78 |
825385.83 |
|
B12 |
Ting Kau Beach |
826277.40 |
825519.01 |
|
B13 |
Approach Beach |
827237.94 |
825301.02 |
|
B14 |
Ma
Wan Beach |
824431.47 |
823415.85 |
|
B24 |
Big Wave Bay Beach |
843474.09 |
811730.33 |
|
B25 |
Rocky Bay Beach |
844030.05 |
810286.64 |
|
B26 |
Shek O Beach |
843891.17 |
809864.31 |
|
F1 |
Tung
Lung Chau Fish Culture Zone |
847571.26 |
813102.00 |
|
F5 |
Ma
Wan Fish Culture Zone |
823875.25 |
823699.48 |
|
WSD5 |
Tsing
Yi flushing water intake |
829862.33 |
823104.16 |
|
WSD6 |
Cheung
Sha Wan flushing water intake |
833991.16 |
820235.42 |
|
WSD7 |
Kowloon
South flushing water intake |
833968.78 |
818053.54 |
|
WSD9 |
Tai
Wan flushing water intake |
837955.17 |
818412.01 |
|
WSD10 |
Cha
Kwo Ling flushing water intake |
841379.00 |
817859.28 |
|
WSD11 |
Yau Tong flushing water intake |
842149.61 |
816974.14 |
|
WSD12 |
Tsueng Kwan O flushing water
intake |
845512.14 |
817421.15 |
|
WSD13 |
Siu
Sai Wan flushing water intake |
843904.21 |
814469.38 |
|
WSD15 |
Sai
Wan Ho flushing water intake |
841215.41 |
816451.38 |
|
WSD17 |
Quarry Bay flushing
water intake |
839685.64 |
817081.46 |
|
WSD18 |
Central
Water Front flushing water intake |
833935.18 |
816624.15 |
|
WSD19 |
Sheung Wan flushing water intake |
833383.13 |
816836.34 |
|
WSD20 |
Kennedy Town flushing
water intake |
830826.34 |
816244.46 |
|
WSD22 |
Wan
Chai flushing water intake |
836246.19 |
816134.92 |
|
VM12 |
Gradient
Station |
830542.34 |
821139.51 |
|
VM14 |
Gradient Station |
829254.66 |
825159.72 |
|
VM15 |
Gradient Station |
832707.02 |
818964.77 |
|
VM8 |
Gradient Station |
830363.95 |
817092.23 |
|
VM7 |
Gradient Station |
832495.44 |
817473.60 |
|
VM5 |
Gradient Station |
836091.75 |
816541.13 |
|
VM2 |
Gradient Station |
839713.80 |
817641.47 |
|
VM4 |
Gradient Station |
838056.49 |
817637.50 |
|
VM1 |
Gradient Station |
841809.43 |
816567.96 |
|
JM3 |
Gradient Station |
844931.70 |
816956.95 |
|
EM1 |
Gradient Station |
844379.62 |
815140.61 |
|
EM2 |
Gradient Station |
845472.92 |
813712.75 |
|
EM3 |
Gradient Station |
845771.79 |
810953.82 |
|
MM13 |
Control
Station |
864290.82 |
808693.11 |
|
SM17 |
Control
Station |
814115.31 |
801690.83 |
|
Case 3 - Emergency
Discharge of Undisinfected CEPT Effluent via the
SCISTW Outfall |
|||
|
B7 |
Anglers’
Beach |
809640.82 |
833462.67 |
|
B8 |
Gemini Beach |
809492.93 |
836402.69 |
|
B9 |
Ho
Mei Wan Beach |
806868.38 |
851275.55 |
|
B10 |
Casam Beach |
801678.43 |
826182.25 |
|
B11 |
Lido Beach |
825917.78 |
825385.83 |
|
B12 |
Ting Kau Beach |
826277.40 |
825519.01 |
|
B13 |
Approach Beach |
827237.94 |
825301.02 |
|
B14 |
Ma
Wan Beach |
824431.47 |
823415.85 |
|
F5 |
Ma
Wan Fish Culture Zone |
823875.25 |
823699.48 |
|
WSD18 |
Central
Water Front |
833935.18 |
816624.15 |
|
WSD19 |
Sheung Wan |
833383.13 |
816836.34 |
|
WSD20 |
Kennedy Town |
830826.34 |
816244.46 |
|
WM4 |
Gradient
Station |
825354.99 |
823325.61 |
|
VM8 |
Gradient
Station |
830363.95 |
817092.23 |
|
VM7 |
Gradient
Station |
832495.44 |
817473.60 |
|
SM6 |
Control
Station |
826179.81 |
805902.89 |
|
SM12 |
Control
Station |
819524.17 |
808420.40 |
|
Case 4 - Bypass of Screened
Sewage from NWKPTW at the Seawall of Stonecutters Island |
|||
|
B7 |
Anglers’
Beach |
809640.82 |
833462.67 |
|
B8 |
Gemini Beach |
809492.93 |
836402.69 |
|
B9 |
Ho
Mei Wan Beach |
806868.38 |
851275.55 |
|
B10 |
Casam Beach |
801678.43 |
826182.25 |
|
B11 |
Lido Beach |
825917.78 |
825385.83 |
|
B12 |
Ting Kau Beach |
826277.40 |
825519.01 |
|
B13 |
Approach Beach |
827237.94 |
825301.02 |
|
B14 |
Ma
Wan Beach |
824431.47 |
823415.85 |
|
F5 |
Ma
Wan Fish Culture Zone |
823875.25 |
823699.48 |
|
VM14 |
Gradient Station |
829254.66 |
825159.72 |
|
WM4 |
Gradient
Station |
825354.99 |
823325.61 |
|
SM6 |
Control
Station |
826179.81 |
805902.89 |
|
SM12 |
Control
Station |
819524.17 |
808420.40 |
Monitoring Schedule
3.6
The water quality
monitoring was conducted from September 2017 to February 2018. The monitoring
schedule is shown in Appendix A.
3.7
For in-situ monitoring, a multi-parameter meter (YSI EXO1) will be used to measure DO, DO saturation, turbidity, salinity, pH and temperature. The equipment used in
the water quality monitoring is summarized in Table 3.2 and the copies of calibration certificates are shown in Appendix B.
Table 3.2 Marine
Water Quality Monitoring Equipment
|
Equipment |
Model and Make |
|
Water Sampler |
Kahlsico Water Sampler 13SWB203 |
|
Multi-parameter Water Quality
Probe |
YSI
EXO1 Multiparameter Sondes |
3.8
The specification of the standard electrodes of the YSI EXO1 for in-situ monitoring is summarized in Table 3.3
Table 3.3
In-situ parameters’ measuring range
|
Dissolved Oxygen |
Range |
0 - 50 mg/L |
|
Accuracy |
±0.1 mg/L |
|
|
pH |
Range |
0 – 14 pH |
|
Accuracy |
± 0.1 pH |
|
|
Temperature |
Range |
-5˚C – 50˚C |
|
Accuracy |
± 0.01˚C |
|
|
Turbidity |
Range |
0 to 4000 FNU |
|
Repeatability |
± 2% of reading |
|
|
Salinity |
Range |
0 – 70.00 ppt |
|
Accuracy |
± 1% of reading |
Notes:
- Accuracy:
the qualitative concept of
an agreeable closeness between the results of the measurement and the true
value of the measured samples.
3.9
A portable, battery-operated and hand held echo
sounder (e.g. Garmin Fishfinder 140) will be used for
the determination of water depth at each designated monitoring station.
3.10 Hand-held
GPS (Magellan eXplorist GC) will be used to ensure the monitoring vessel is at
the correct location before taking measurements.
Monitoring Parameters and Frequency
3.11 Table 3.4 summarizes the monitoring parameters, monitoring
period and frequencies of the water quality monitoring.
Table 3.4 Water
Quality Monitoring Parameters and Frequency
|
Depth |
Frequency |
|
|
In-situ
Parameters: ·
Temperature ·
pH ·
Water depth ·
DO, mg/L ·
DO Saturation, % ·
Salinity, ppt ·
Turbidity, NTU |
· 3 water depths: 1m below water
surface, mid-depth and 1m above sea bed. · If the water depth is less than
3m, mid-depth sampling only. · If the water depth is between
3-6m, omit mid-depth sampling. |
· Baseline monitoring: once per
month for 6 months |
|
Laboratory Testing Parameters: ·
E. coli, cfu/100ml |
3.12 Multi-parameter
meter (e.g. YSI EXO1) was used
to measure the in-situ parameter. At each measurement, two consecutive
measurements of pH level, DO concentration, DO saturation, salinity, turbidity
and temperature will be taken.
Where the difference in the value between the first and second readings
of each set is more than 25% of the value of the first reading, the reading
will be discarded and further readings will be taken. A single measured sample
at each water depth will be collected
for E. coli analysis.
3.13 Each water
sample of about 250 ml were collected
and stored in glass bottles. The sample bottles were packed into ice-box and
delivered to a HOKLAS-accredited Laboratory, WELLAB Ltd., for the analysis of E. coli within 24
hours.
QA/QC for
Laboratory Analysis
3.14 The
testing laboratory implemented QA/QC measures for the
analysis of water samples in order to obtain reliable data that is
technically defendable, which including the followings:
Medium
Quality Control
3.14 Medium
quality control samples were prepared to check the signs of contamination and
deterioration of the culture medium for E.
coli growth. Test for those organisms showed different colours of colonies,
such as E. aerogenes,
P. aeruginosa, K. pneumoniae and E. faecalis, were also included in the medium quality
control samples.
Method
Quality Control
3.15 A
laboratory blank sample was analysed under the same sample preparation and
analytical procedure as the field samples. Method blank sample is to assess if
there is contamination during laboratory testing.
3.16 Positive
control and negative control samples were prepared to ensure colonies would
show their respective colours on the culture medium.
QC laboratory sample
duplicate
3.17 At least
one set of QC sample was analysed for each batch of samples ≤ 20 samples. The
sample duplicate test results were used to assess the
precision of the analytical process.
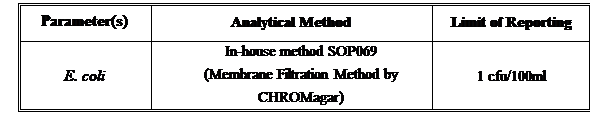
3.18 The
analysis will commence within 24 hours after collection of the water samples.
The list of parameter to be analysed as well as the suggested corresponding
analytical method and reporting limit are listed in Table 3.5.
Table 3.5 Suggested Analytical
Method for Laboratory Analysis for Marine Water Samples
 Maintenance and Calibration
3.19 Before
each round of monitoring, a zero check in distilled water will be performed
with the probes in the YSI EXO1. The probes will be calibrated with a
known standard solution.
3.20 Laboratory testing for E. coli which is analysed in the HOKLAS-accredited laboratory, WELLAB
Ltd, are attached in Appendix E.