3.
WATER QUALITY Monitoring
3.1
The
monitoring frequency will be once per month for three consecutive months at all
designated monitoring stations during dry season. The monitoring stations are
listed in Table 3.1.
3.2
Water
sampling will be conducted two times per monitoring day during mid-ebb and mid-flood
tides at three water depths (1 meter below surface, mid-water depth and 1 meter
above seabed). Parameters such as temperature, dissolved oxygen (DO)
concentration, DO saturation, turbidity, salinity, pH and E. coli will be monitored.
A total of 42 monitoring stations are designated
for the water quality monitoring, with
the beach locations and the Fish Culture Zone being the
sensitive receivers. The locations are summarized in Table 3.1 and
shown on Figure 2-1. The
observations recorded during data sampling were summarized in Section 4.4.
Table 3.1
Water Quality Monitoring Station
|
Monitoring
Station |
Description |
Easting |
Northing |
*Justification
for changes to the proposed coordinates |
|
B7 |
Anglers’
Beach* |
823867.89 |
825006.20 |
Inaccessible due to shark nets |
|
B8 |
Gemini Beach |
825215.29 |
824933.71 |
- |
|
B9 |
Ho
Mei Wan Beach* |
825444.58 |
825102.99 |
Inaccessible due to shark nets |
|
B10 |
Casam Beach* |
825711.64 |
825302.00 |
Inaccessible due to shark nets |
|
B11 |
Lido Beach* |
825958.86 |
825353.49 |
Inaccessible due to shark nets /
marked on the shore |
|
B12 |
Ting Kau Beach |
826277.40 |
825519.01 |
- |
|
B13 |
Approach Beach |
827237.94 |
825301.02 |
- |
|
B14 |
Ma
Wan Beach* |
824453.65 |
823394.59 |
Inaccessible due to shark nets |
|
B24 |
Big Wave Bay Beach* |
843785.32 |
811659.26 |
Location marked on the shore |
|
B25 |
Rocky Bay Beach* |
844072.75 |
810378.64 |
Location marked on the shore |
|
B26 |
Shek
O Beach* |
844265.64 |
809769.15 |
Inaccessible due to shark nets |
|
F1 |
Tung
Lung Chau Fish Culture Zone |
847571.26 |
813102.00 |
- |
|
F5 |
Ma
Wan Fish Culture Zone |
823875.25 |
823699.48 |
- |
|
WSD5 |
Tsing
Yi flushing water intake |
829862.33 |
823104.16 |
- |
|
WSD6 |
Cheung
Sha Wan flushing water intake |
833991.16 |
820235.42 |
- |
|
WSD7 |
Kowloon
South flushing water intake* |
833919.11 |
818053.71 |
Location marked on shore |
|
WSD9 |
Tai
Wan flushing water intake |
837955.17 |
818412.01 |
- |
|
WSD10 |
Cha
Kwo Ling flushing water intake |
841379.00 |
817859.28 |
- |
|
WSD11 |
Yau
Tong flushing water intake |
842149.61 |
816974.14 |
- |
|
WSD12 |
Tsueng
Kwan O flushing water intake |
845512.14 |
817421.15 |
- |
|
WSD13 |
Siu
Sai Wan flushing water intake |
843904.21 |
814469.38 |
- |
|
WSD15 |
Sai
Wan Ho flushing water intake |
841215.41 |
816451.38 |
- |
|
WSD17 |
Quarry Bay flushing
water intake |
839685.64 |
817081.46 |
- |
|
WSD18 |
Central
Water Front flushing water intake |
833935.18 |
816624.15 |
- |
|
WSD19 |
Sheung
Wan flushing water intake* |
833146.17 |
816945.60 |
Blockage of ferry route |
|
WSD20 |
Kennedy Town flushing
water intake |
830826.34 |
816244.46 |
- |
|
WSD22 |
Wan
Chai flushing water intake |
836246.19 |
816134.92 |
- |
|
VM12 |
Gradient
Station |
830542.34 |
821139.51 |
- |
|
VM14 |
Gradient
Station |
829254.66 |
825159.72 |
- |
|
VM15 |
Gradient
Station |
832707.02 |
818964.77 |
- |
|
VM8 |
Gradient
Station |
830363.95 |
817092.23 |
- |
|
VM7 |
Gradient
Station |
832495.44 |
817473.60 |
- |
|
VM5 |
Gradient
Station |
836091.75 |
816541.13 |
- |
|
VM2 |
Gradient
Station |
839713.80 |
817641.47 |
- |
|
VM4 |
Gradient
Station |
838056.49 |
817637.50 |
- |
|
VM1 |
Gradient
Station |
841809.43 |
816567.96 |
- |
|
JM3 |
Gradient
Station |
844931.70 |
816956.95 |
- |
|
EM1 |
Gradient
Station |
844379.62 |
815140.61 |
- |
|
EM2 |
Gradient
Station |
845472.92 |
813712.75 |
- |
|
EM3 |
Gradient
Station |
845771.79 |
810953.82 |
- |
|
MM13 |
Control
Station |
864290.82 |
808693.11 |
- |
|
SM17 |
Control
Station |
814115.31 |
801690.83 |
- |
Remark*:
- Another HATS Stage 2A project, Contract No. DC/2009/18, had also
encountered similar onsite conditions during baseline water sampling for the
Temporary Flow Diversion Works in 2013. The monitoring coordinates were
adjusted at the site and were subsequently addressed in its baseline report. The
current monitoring had encountered similar issues and the justification for the
changes to the proposed coordinates were presented in Table 3.1 above.
Monitoring Schedule
3.4
The water quality monitoring was conducted on 22
November 2014, 13 December 2014 and 24 January 2015. The monitoring schedule is
shown in Appendix A.
3.5
For in-situ monitoring, a multi-parameter meter (Aquaprobe Model
AP-2000) will be used to measure DO, DO saturation, turbidity,
salinity, pH and temperature. The equipment
used in the water quality monitoring is summarized in Table 3.2 and the copies of calibration certificates are shown in Appendix B.
Table
3.2 Marine
Water Quality Monitoring Equipment
|
Equipment |
Model and Make |
Qty |
|
Water Sampler |
Kahlsico
Water Sampler 13SWB203 |
4 |
|
Multi-parameter Water Quality Probe |
Aquaprobe
Model AP-2000 |
4 |
|
Sonde Environmental Monitoring System |
YSI
Model 6820 C-M |
1 |
* The YSI model was
used by Route 3 monitoring team on 24 January 2015 instead of the Aquaprobe mode.
3.6
The
specification of the standard electrodes of the Model AP-2000 for in-situ
monitoring is summarized in Table 3.3
Table 3.3
In-situ parameters’ measuring range
|
Aquaprobe Model AP-2000 |
||
|
Dissolved Oxygen |
Range |
0 –
500.0% / 0 – 50.00 mg/L |
|
Accuracy |
0 -
200%: ± 1% of reading. 200% - 500%: ± 10% |
|
|
pH |
Range |
0 –
14 pH |
|
Accuracy |
±
0.1 pH |
|
|
Temperature |
Range |
-5˚C
– +50˚C |
|
Accuracy |
±
0.5˚C |
|
|
Turbidity |
Range |
0 –
3000 NTU |
|
Accuracy |
±
5% of reading |
|
|
Salinity |
Range |
0 –
70 PSU / 0 – 70.00 ppt (g/Kg) |
|
Accuracy |
±
1% of reading |
|
|
YSI Model 6820 C-M |
||
|
Dissolved Oxygen |
Range |
0
to 50 mg/L |
|
Accuracy |
0
to 20 mg/L: ± 0.2 mg/L or 2% of reading; 20 to 50 mg/L: ±6% of reading |
|
|
pH |
Range |
0
to 14 pH |
|
Accuracy |
±0.2
pH |
|
|
Temperature |
Range |
5
to +50°C |
|
Accuracy |
±0.15°C |
|
|
Turbidity |
Range |
0
to 1,000 NTU |
|
Accuracy |
±2%
of reading or 0.3 NTU |
|
|
Salinity |
Range |
0
to 70 ppt |
|
Accuracy |
±1%
of reading or 0.1 ppt |
|
Notes:
-
Accuracy: the qualitative concept of an agreeable closeness between the
result of the measurement and the true value of the measured samples.
3.7
A
portable, battery-operated and hand held echo sounder (e.g. Garmin Fishfinder 140) will be used for the determination of water
depth at each designated monitoring station.
3.8
Hand-held
GPS (Magellan eXplorist GC) will be used to ensure the monitoring vessel is at
the correct location before taking measurements.
Monitoring
Parameters and Frequency
3.9
Table 3.4 summarizes the monitoring parameters,
monitoring period and frequencies of the water quality monitoring.
Table 3.4 Water
Quality Monitoring Parameters and Frequency
|
Depth |
Frequency |
|
|
In-situ Parameters: ·
Temperature ·
pH ·
Water
depth ·
DO, mg/L ·
DO Saturation, % ·
Salinity, ppt ·
Turbidity, NTU |
· 3 water depths: 1m below water surface,
mid-depth and 1m above sea bed. · If the water depth is less than 3m,
mid-depth sampling only. · If the water depth is between 3-6m, omit
mid-depth sampling. |
· Baseline monitoring: once per month for 3
consecutive months |
|
Laboratory Testing Parameters: ·
E. coli,
cfu/100ml |
3.10
Multi-parameter
meter (e.g. Aquaprobe Model AP-2000) was
used to measure the
in-situ parameter. At each measurement, two consecutive measurements of pH
level, DO concentration, DO saturation, salinity, turbidity and temperature
will be taken. Where the difference
in the value between the first and second readings of each set is more than 25%
of the value of the first reading, the reading will be discarded and further
readings will be taken. A single measured sample at each water depth will be collected for E. coli analysis.
3.11
Each
water sample of about 250 ml were collected and stored in glass bottles. The sample bottles were
packed into ice-box and delivered to a HOKLAS-accredited Laboratory, WELLAB
Ltd., for the analysis of E. coli within 24 hours.
QA/QC for Laboratory Analysis
3.12
The
testing laboratory implemented QA/QC measures for the analysis of water samples in
order to obtain reliable data that is technically defendable, which including the
followings:
Medium
Quality Control
3.14
Medium
quality control samples were prepared to check the signs of contamination and
deterioration of the culture medium for E.
coli growth. Test for those organisms showed different colours of colonies,
such as E. aerogenes,
P. aeruginosa, K. pneumoniae and E. faecalis, were also included in the
medium quality control samples.
Method
Quality Control
3.15
A
laboratory blank sample was analysed under the same sample preparation and
analytical procedure as the field samples. Method blank sample is to assess if
there is contamination during laboratory testing.
3.16
Positive
control and negative control samples were prepared to ensure colonies would
show their respective colours on the culture medium.
QC laboratory sample duplicate
3.17
At
least one set of QC sample was analysed for each batch of samples ≤ 20 samples.
The sample duplicate test results were used to assess the precision of the
analytical process.
3.18
The
analysis will commence within 24 hours after collection of the water samples.
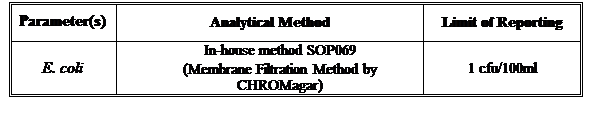
The list of parameter to be analysed as well as the suggested corresponding
analytical method and reporting limit are listed in Table 3.5.
Table 3.5 Suggested
Analytical Method for Laboratory Analysis for Marine Water Samples
Maintenance and Calibration
3.19 Before
each round of monitoring, a zero check in distilled water will be performed
with the probes in the Model AP-2000 and the YSI 6820 C-M. The probes will be calibrated with a
known standard solution.
3.20
Laboratory testing and QC reports for E. coli which is analysed in the HOKLAS-accredited laboratory, WELLAB Ltd, are attached
in Appendix E.